Over the last 30 years, active listings have stood as
an important measure for understanding the condition of our housing
market. A surplus of listings creates conditions favorable to buyers,
while a deficit in listings will favor sellers. 2014 through mid-2018
represented a historic period of extreme low inventory. This period shaped
our robust housing market that continues today. From May 2018 through
January 2019 inventory levels started growing and so too did the feeling
of a sense of optimism from buyer’s agents and concern from listing agents
as we foresaw a more balanced market in our future.
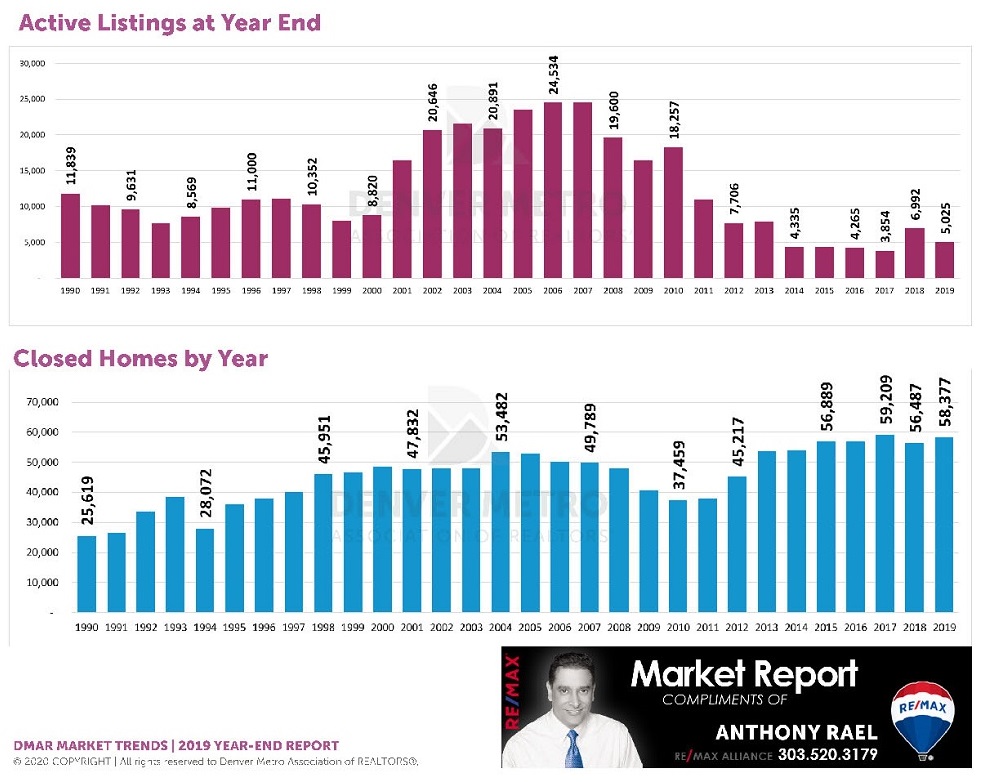
Active listings reached their lowest point in December of 2017 with 3,854
listings. A year later, that number increased 44.7 percent to 5,577. This
growth in inventory was due in part to sluggish sales and a higher number
of new listings entering the market. According to the numbers, this trend
started to reverse itself towards the midpoint of 2019 with November
representing the first month in the previous 13 that showed a decrease in
listings compared to the previous year. We finished 2019 down 9.7 percent
from 2018 in active listings. Are we heading back to a shortage of
inventory? The trend suggests yes, at least through the first half of 2020
and possibly longer as buyer demand remains strong.
Unlike other historical numbers we track, active listings generally will
not increase year to year. 2019’s year-end number represents 41.1 percent
of our 30-year annual average of 12,262. Our record-high came in July of
2006 when we recorded 31,989 listings. During that period of record highs,
months of inventory stood at 6.6 months which implied a robust buyer’s
market in which everyone had a listing but agents with buyers were king.
Today’s 1.2 months of inventory stands in significant contrast from 2006
as we continue to remain a seller’s market.
2019 represented the second highest year for closings in Denver Metro
history. We finished with 58,404 closed transactions. This represents an
increase of 3.43 percent from 2018. 2019 also represented the fifth year
in a row exceeding 56,000 transactions. In 1990 we closed only 25,619
homes. Thirty years later, we’ve closed 120.5 percent more homes. When
examining historical numbers, it’s important to consider factors like an
increase in total housing units and population changes. Not only was 2017
our historical high with 59,207 closings, but nationally it was also a
record year.
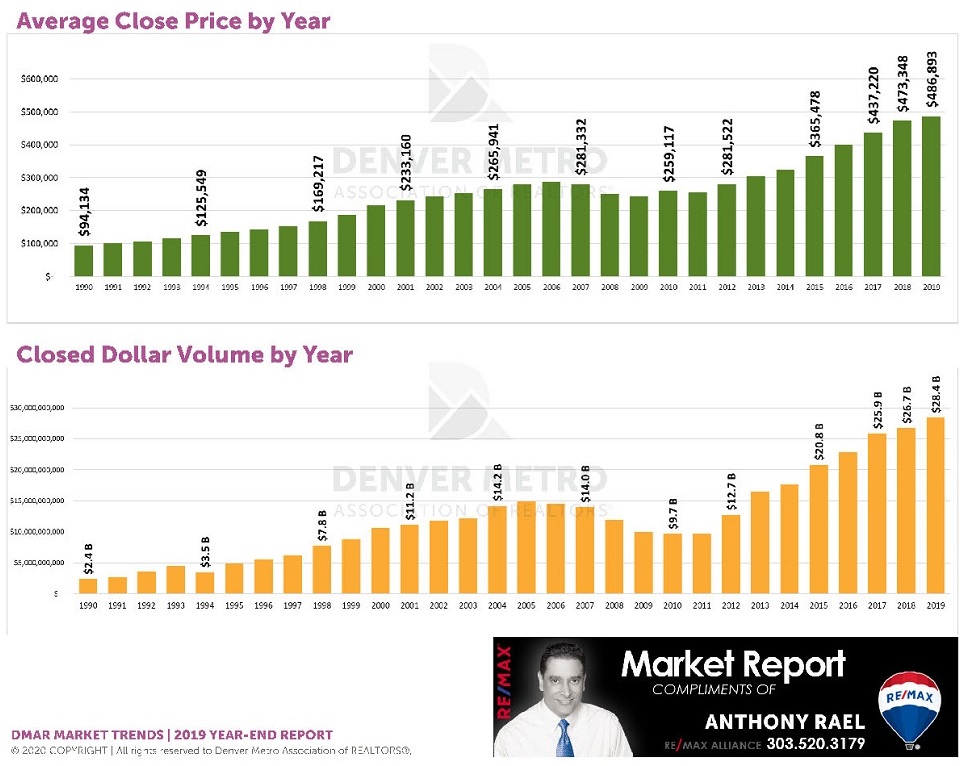
Over the last 30 years, home prices have seen robust growth demonstrating
homeownership is the primary driver of personal wealth. The average sold
price in 2019 was $486,695, an increase of 2.85 percent from 2018. 2019
established a new historical high and marked the eighth consecutive year
of price gains. Over the last 30 years, the average price has increased a
staggering 417 percent. Growth has been consistent since 1990 except
during the mortgage market collapse from 2007-2009. This was the only time
where year-over-year prices dropped. The good news: our recovery has been
one of the strongest in the nation. Our pre-recession high was 2006 at
$288,916. Since that time, prices have increased 68.6 percent. That
increase is one of the highest price recoveries in the nation.
The Denver Metro housing market has experienced highs and lows over the
last 30 years. The early 2000s gave us fast and loose lending practices
that burst our housing bubble and made short sales a common thing. Think
of that period as a forest that had too much undergrowth that then
experienced several years of drought. The market burned down. With all
that bad came some good as we were left with a healthier and more
sustainable housing market.
Source:
Denver Metro Association of REALTORS® Market Trends Committee


